Context diagram template
Created by:

Map external connections and data flows in one clear visual framework to streamline system planning
Categories
- Software & IT
- Design
- Whiteboard Template
KEY FEATURES
Documentation
Requirements
Communication
Context diagrams can help you understand how any system connects with the outside world. Whether planning a new software application, documenting business processes, or explaining complex workflows to stakeholders, a context diagram template can provide the structure you need to start quickly.
These templates eliminate the guesswork by offering pre-built frameworks that guide you through identifying key components, external entities, and the data flows that connect them.
What is a context diagram?
A context diagram represents a system and its interactions with external entities. It provides a bird's-eye view that shows what enters and exits your system without getting bogged down in the internal mechanics. Unlike detailed flowcharts or complex technical documentation, context diagrams focus exclusively on the boundary between your system and everything that interacts with it.
Context diagrams are simple. They deliberately avoid showing internal processes, instead concentrating on the high-level relationships that matter most during the early planning stages.
What is a context diagram template?
A context diagram template provides a pre-structured format that helps users quickly build professional diagrams without starting from scratch. These templates typically include designated spaces for the central system, external entities, and the data flows that connect them. Rather than spending time figuring out layout and formatting, teams can focus on identifying the actual relationships and interactions that matter.
Business context diagram templates come with helpful placeholders to guide users through the process. These templates ensure consistency across different projects and teams while reducing the learning curve for new users.
DFD vs. context diagram
While both context diagrams and data flow diagrams (DFDs) deal with system interactions, they serve different purposes and display varying levels of detail. Context diagrams focus on top-level interactions between a system and its external environment.
On the other hand, data flow diagrams dive deeper into the actual processing that happens within a system. They break down internal processes, show how data transforms as it moves through different stages, and reveal the detailed mechanics of system operation.
Context diagrams are often the starting point that sets the stage for more detailed analysis through DFDs.
Elements of a context diagram template
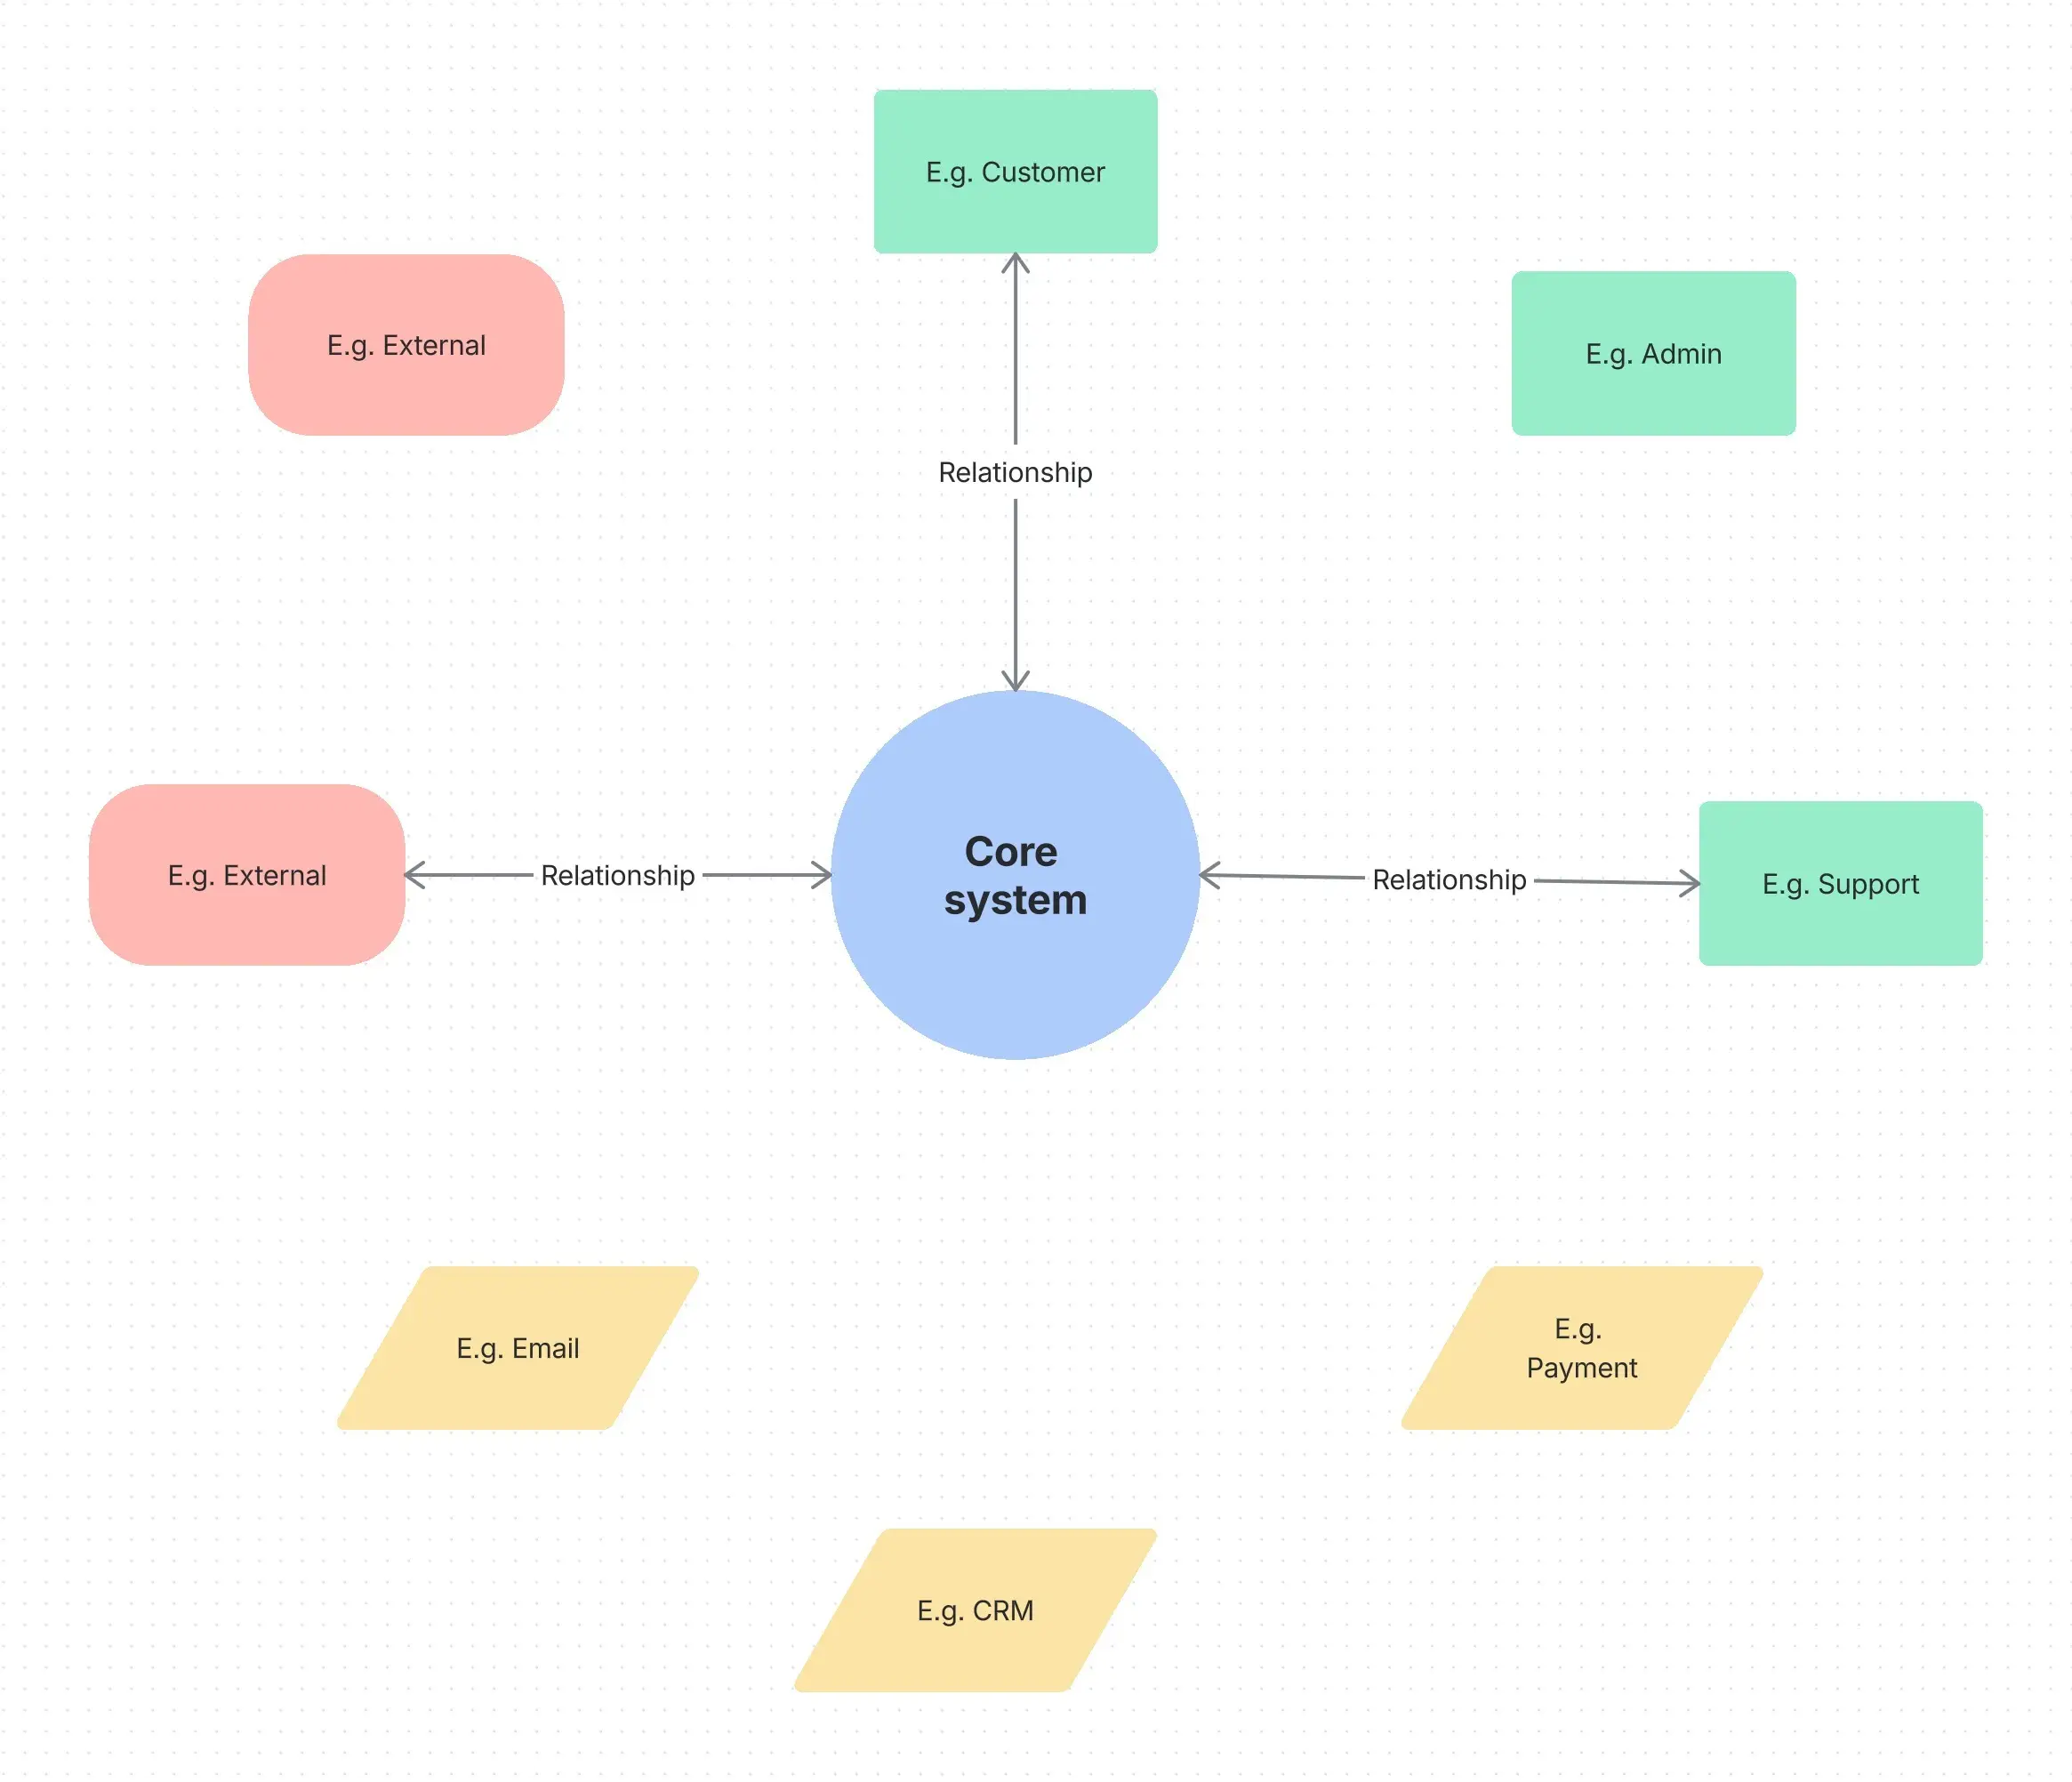
An effective system context diagram template includes three essential components that work together to create a complete picture. These include:
Central system: This sits at the heart of the diagram, representing the process, application, or business function you're analyzing. It could be anything from a customer management system to an entire department's workflow, and it is the focal point for all external interactions.
External entities: These surround the central system and represent people, organizations, or other systems that interact with your system. They might include customers, suppliers, regulatory bodies, or integrated software applications — essentially anything that sends information to or receives information from your system.
Data flows: These connect the system to external entities using labeled arrows that show what type of information or resources move between them. They indicate both the direction and nature of the exchange, whether it's customer orders flowing in, reports flowing out, or two-way communication between integrated systems.
Use cases of a context diagram template
Context diagrams are invaluable during system planning phases when teams need to understand scope and boundaries before diving into detailed design work. They help project managers communicate with stakeholders by providing a clear, non-technical overview of how a proposed system will fit into the existing business environment.
Technical teams use context diagrams to establish system boundaries and identify integration points with other applications or services. This helps prevent scope creep and ensures that everyone understands what is included in the project and what is considered external.
Non-technical stakeholders appreciate context diagrams because they can quickly grasp the system's purpose and relationship without getting overwhelmed by technical details.
Project collaboration also becomes much more effective when teams have a shared visual reference that everyone can understand and discuss. Context diagrams improve decision-making by making abstract concepts concrete and discussable.
Context diagram example
Consider an e-commerce system as our example. The central system would be labeled "Online Store Platform" and placed in the center of the diagram. External entities include customers, payment processors, inventory systems, and shipping companies. Data flows would show customer orders entering the system, payment information being sent to processors, inventory updates coming from warehouse systems, and shipping notifications being relayed to delivery companies.
In this example, context diagrams capture the essential relationships without delving into the technical details of how orders are processed internally or how the payment system operates. The focus remains on what crosses the system boundary and who is involved in those exchanges.
Benefits
Simplifies complex processes
Context diagrams break down large, complex systems into manageable, easy-to-understand components that anyone can quickly grasp. They help reduce confusion during early planning stages by focusing attention on the most important relationships rather than overwhelming teams with internal complexity.
Improves communication
The diagram acts as a visual reference during discussions, making it easier for teams to explain ideas, make decisions, and resolve misunderstandings. By providing a common language, it helps cross-functional teams communicate more effectively and keeps conversations focused on the system’s defined scope.
Supports effective planning
A clear overview of inputs and outputs provides the foundation for better system design and more accurate project planning. When teams understand the full scope of external interactions, they can make informed decisions about resources, timelines, and technical approaches.
Aligns teams
Context diagrams ensure that everyone has a consistent understanding of the system and its role within the broader organizational context. This alignment helps teams work better together and reduces miscommunication that can slow progress.
How to use the context diagram template
- 1
Define the system
Identify the specific system or process you want to diagram and give it a clear, descriptive name that everyone will understand. Place this system at the center of your diagram, where it will serve as the focal point for all external interactions.
- 2
List external entities
Identify all the people, systems, organizations, or other actors that interact with your central system in any way. Use consistent, descriptive labels that clearly indicate what each entity represents and avoid technical jargon that might confuse stakeholders.
- 3
Determine data flows
Carefully note the types of data, information, or resources that move between your system and each external entity. Describe both the direction and nature of each flow, being specific about what's being exchanged rather than using vague terms.
- 4
Draw the system boundary
Create a clear box or boundary around your central system to visually distinguish it from external actors. This boundary should be clearly defined to help viewers understand what is inside your system versus what is outside it.
- 5
Connect external entities
Use labeled arrows to show the interactions between external entities and your central system. Ensure that each arrow clearly indicates what is being exchanged and in which direction the flow occurs.
- 6
Review and share
Double-check your completed diagram for completeness and accuracy, then share it with stakeholders to gather feedback and ensure alignment. This review process often reveals missing entities or flows that weren't obvious during initial creation.
Create a context diagram in Confluence
Using a context diagram template in Confluence streamlines the entire process of creating professional diagrams from scratch. The platform's built-in templates provide the structure you need, while online whiteboards offer the flexibility to customize and collaborate in real time. Teams can work together simultaneously, adding entities, adjusting flows, and refining the diagram as understanding develops.
Confluence's diagram-maker integrates seamlessly with your existing project documentation, making it easy to reference context diagrams throughout the development process. Whether you're creating a workflow diagram, developing a whiteboard strategy, or building a process flow chart, having your context diagram readily available in the same platform keeps everything connected and accessible to your entire team.
Explore more templates to supercharge teamwork
Empower everyone, on every team. Build, connect, and deliver your biggest ideas seamlessly across Atlassian apps using our complete collection of ready-made workflows.